We are very pleased to announce that VTS 3.2 “Zenith” has just been released and is available for download.
VTS 3.2 owes its name to the new client application called “ZenithView”. Some of the new features aim to help the Operational Orbit Determination Centre (COO) at CNES in their work of avoiding satellite collision (FR article) with space debris or other satellites.
What’s new ?
ZenithView
ZenithView displays the celestial sphere as seen from a ground station. More precisely it displays a Lambert azimuthal equal-area projection of the celestial sphere centered on a specific ground station.
ZenithView animation displaying satellite flybys
Satellites and celestial bodies are projected according to their position relative to the station.
As you can see in the image, objects outside the field of view can be projected on the horizon (or not displayed at all).
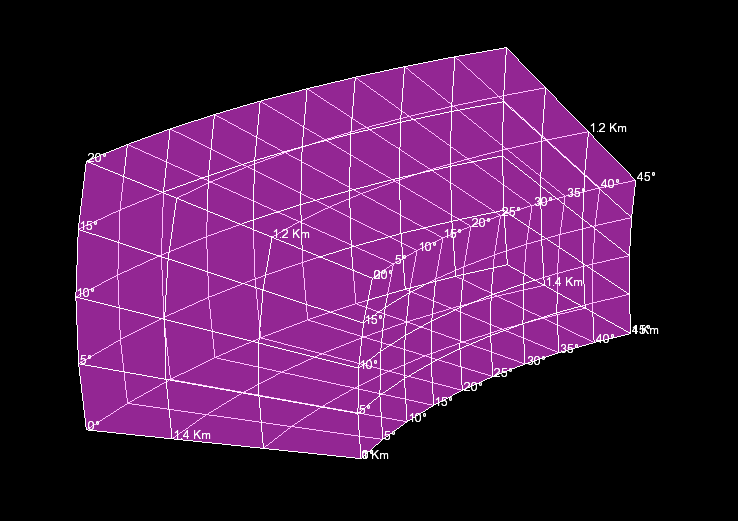
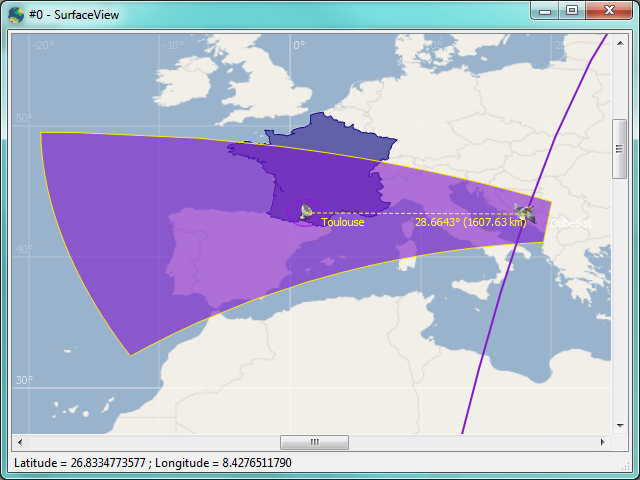
Ground station sensors & masks
Ground stations now supports multiple (and orientable) sensors that can be displayed both in 2D and 3D.
Visibility masks can now be defined for ground stations. Masks are defined in the station frame using azimuth/elevation data files and are displayed in ZenithView.
More on this coming soon!
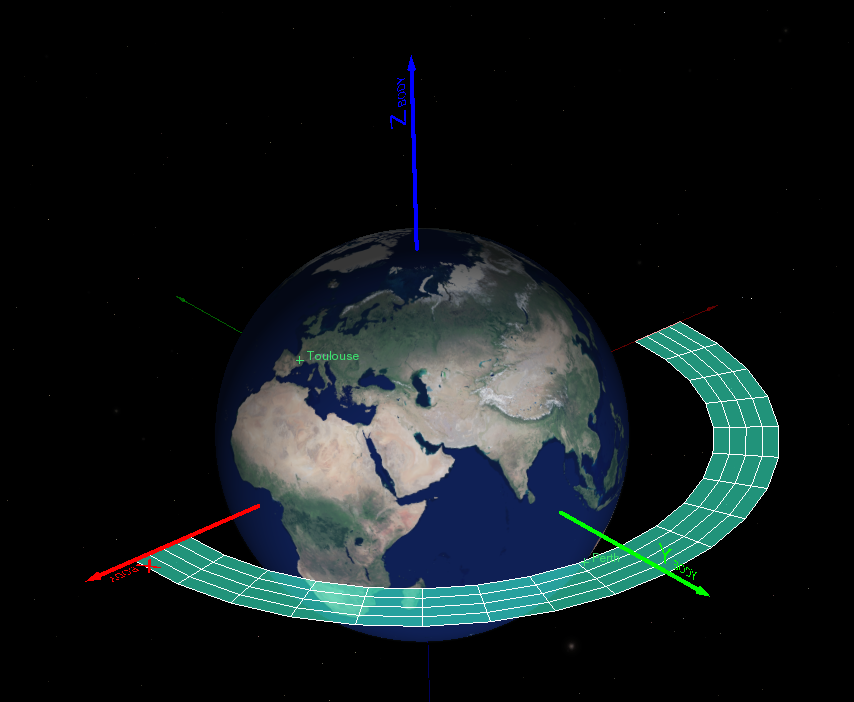
Positional covariance
The positional covariance of a satellite can now be displayed in 3D as an ellipsoid representing the uncertainty of an orbit state. This can be done with either fixed or time-dependent data.
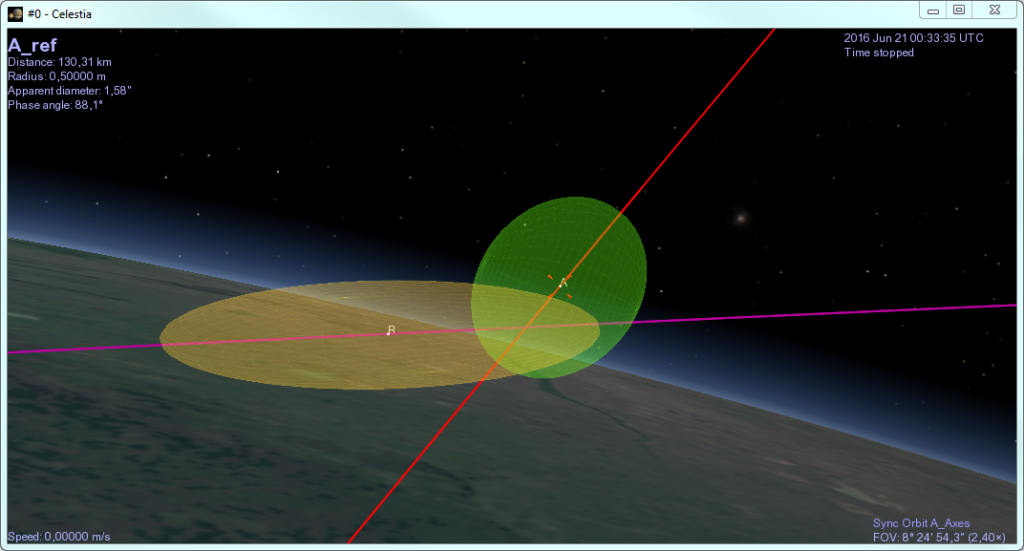
Example of positional covariance ellipsoids in 3D
Window Geometry Manager
The new window geometry manager allows you to configure the position and size of each client application defined in your VTS project.
Client applications can be easily placed on the primary or secondary screens and their positions and size will be adapted to different screen configurations.
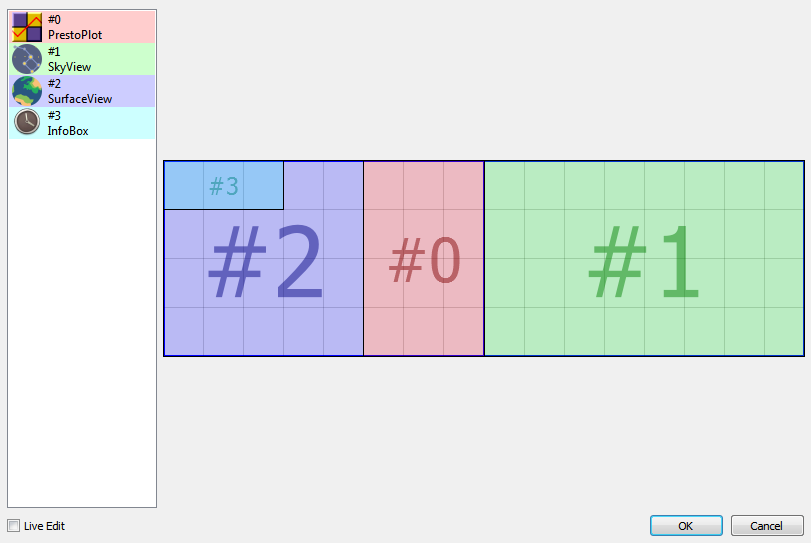
The new window geometry manager
Frameless and always-on-top
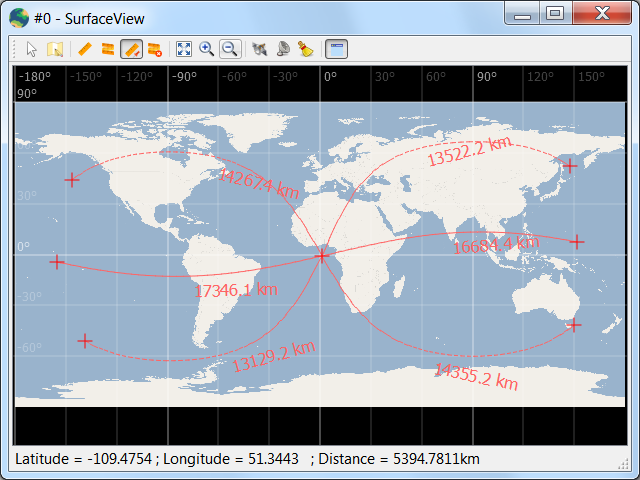
OmniView now supports Frameless and Always-on-top modes. As seen in the image below, these modes can be used to create more friendly and cleaner visualizations.
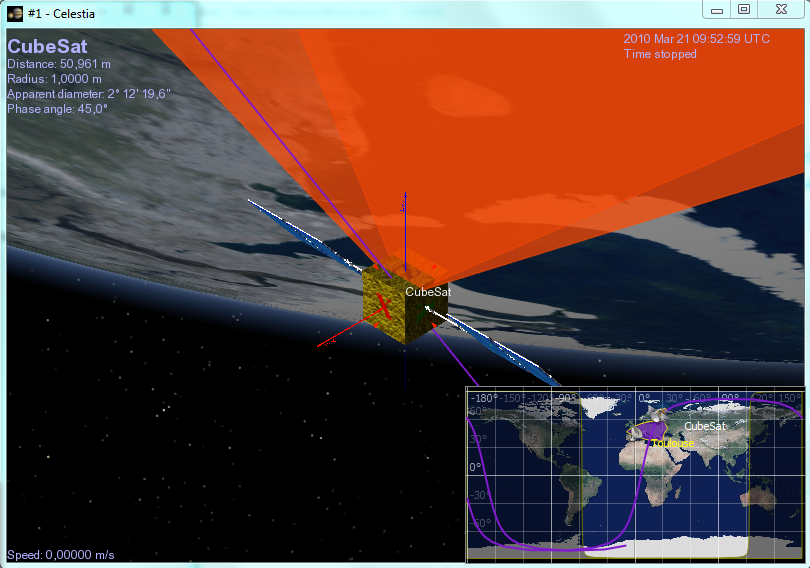
SurfaceView minimap created with frameless and always-on-top modes
User Manual & Contextual Help
A brand new HTML User Manual is shipped with VTS 3.2 and accessible from the Help menu in VTS.
Contextual help is also available by pressing F1 key.
PrestoPlot 2017
VTS is now shipped with PrestoPlot v17.07. This is a big step forward bringing new features, performance improvements, and bugfixes to the VTS package.
Synchronize your own application !
VTS 3.2 is shipped with examples showing how to connect and synchronize your own applications using Python, Tcl and Java.
You will also find an XSD schema describing the VTS project in the [VTS]/Docs/Schemas directory. This schema allows you to generate an API in the programming language of your preference and to create valid VTS projects programatically. Please refer to the “Plugin development” chapter in the VTS User Manual.
And much more…
To see the complete list of features, improvements and bugfixes included in VTS 3.2 please read the full changelog.
We want to hear from you !
As always we are interested in your feedback to keep improving VTS.
Take a look at our contact page to send us any comment, suggestion or question you might have.