VTS is an extensible platform for synchronizing visualization applications.
Widely used from well-known space missions to academic research.
VTS is designed to be robust, extensible and user-friendly.
VTS Mission
Syncronization & Visualization
VTS doesn’t aim to do everything for everyone.
Instead, it focuses on synchronizing and visualizing your data
leaving domain-specific features out of the scope.
Synchronize
Simplified Data Analysis
VTS makes synchronization between timed-based applications easy.
PLOT
Value = f(t)

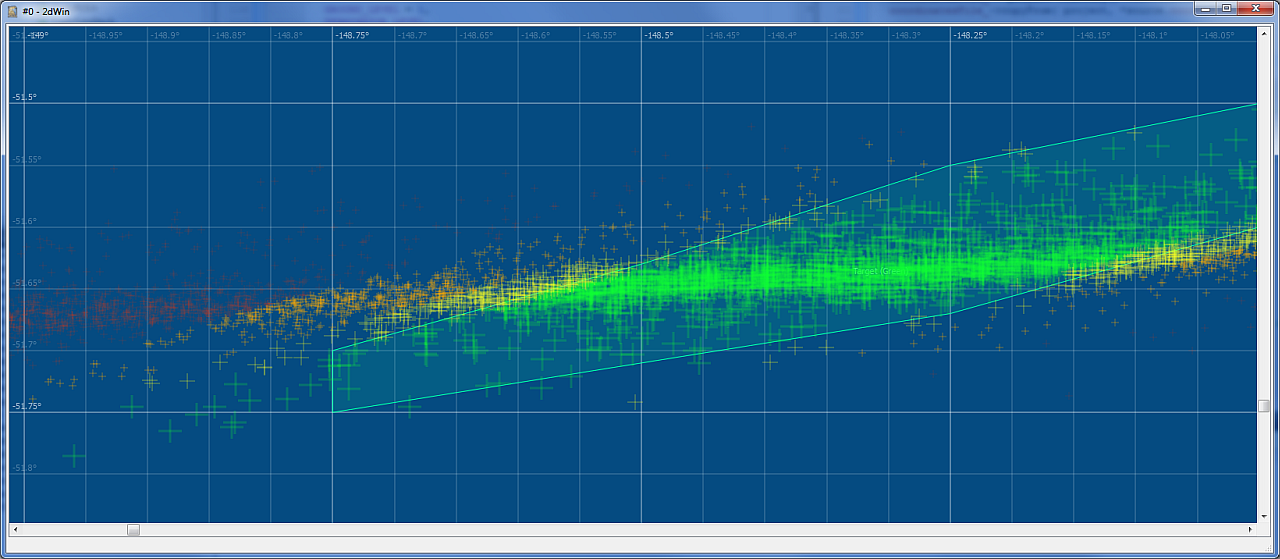
2D
Latitude and longitude = f(t)

3D
Attitude and position = f(t)
SYNOPTIC
State = f(t)
TABLE
Current line = f(t)
Visualize
Bundled with Client Applications
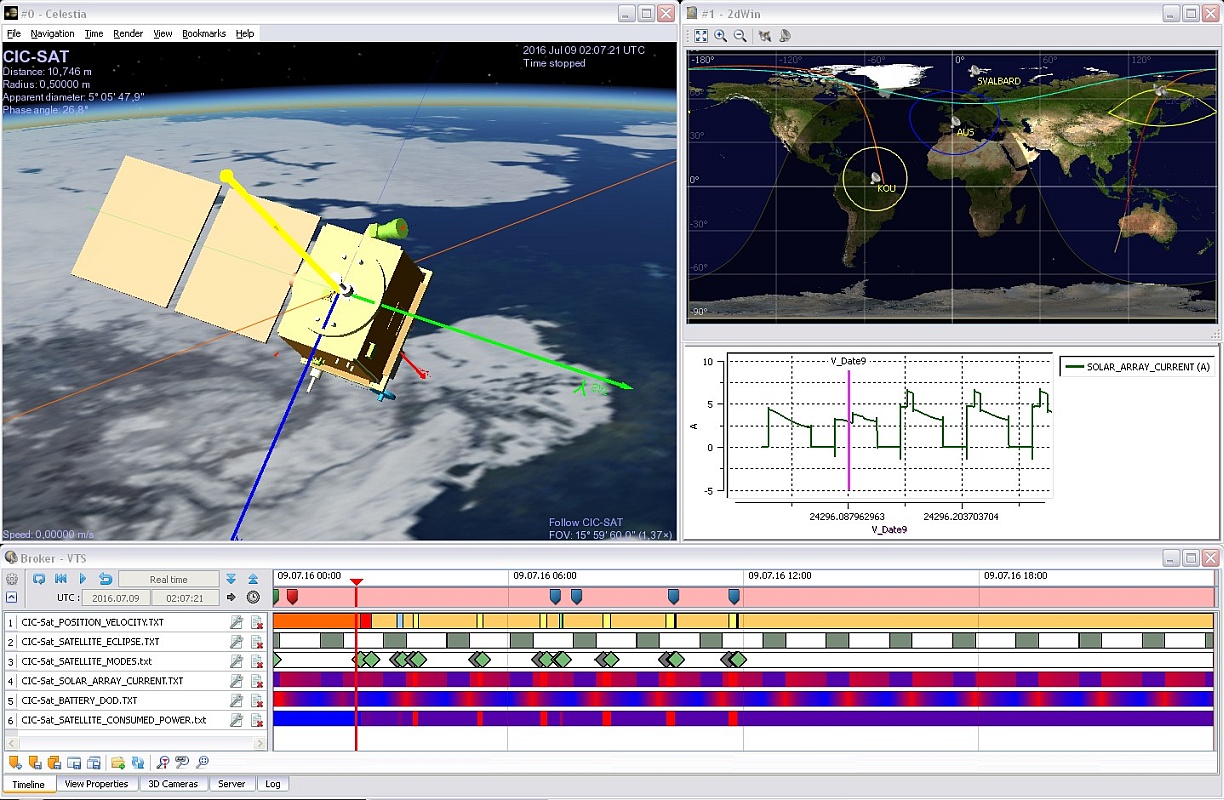
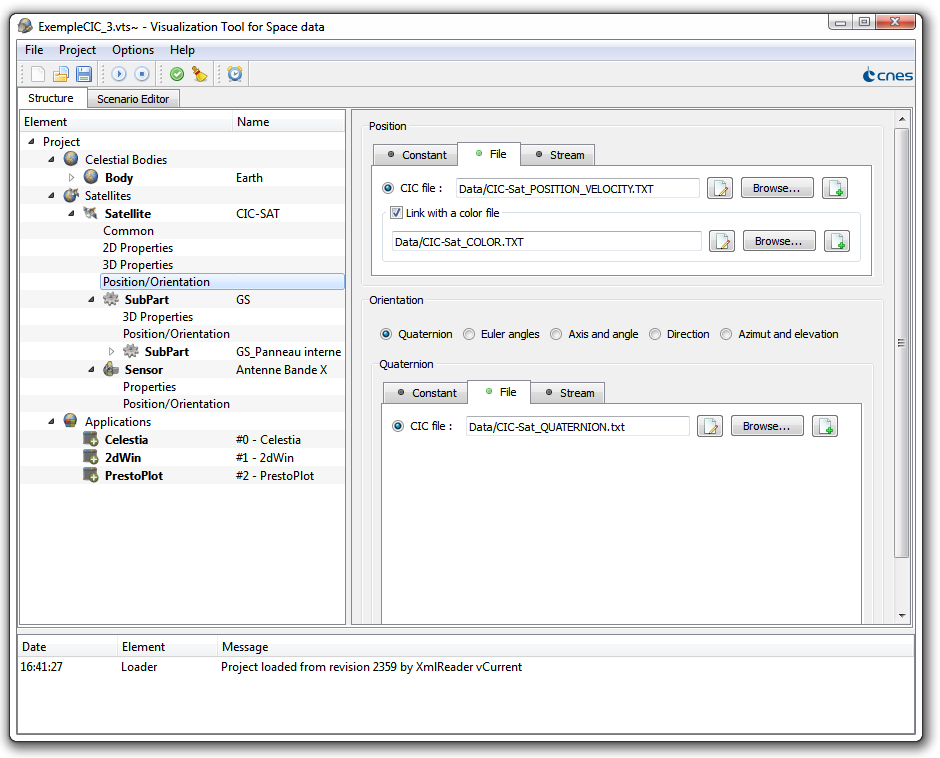
Timeloop VTS is not a single application. It's a workshop for creating projects and synchronizing client applications. Standard client applications are bundled for 2D, 3D visualization and data plotting.
Data Correlation
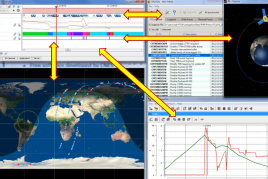
VTS can synchronize multiple client applications, simplifying data analysis.
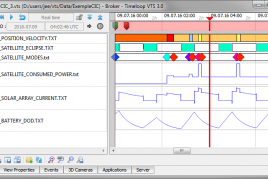
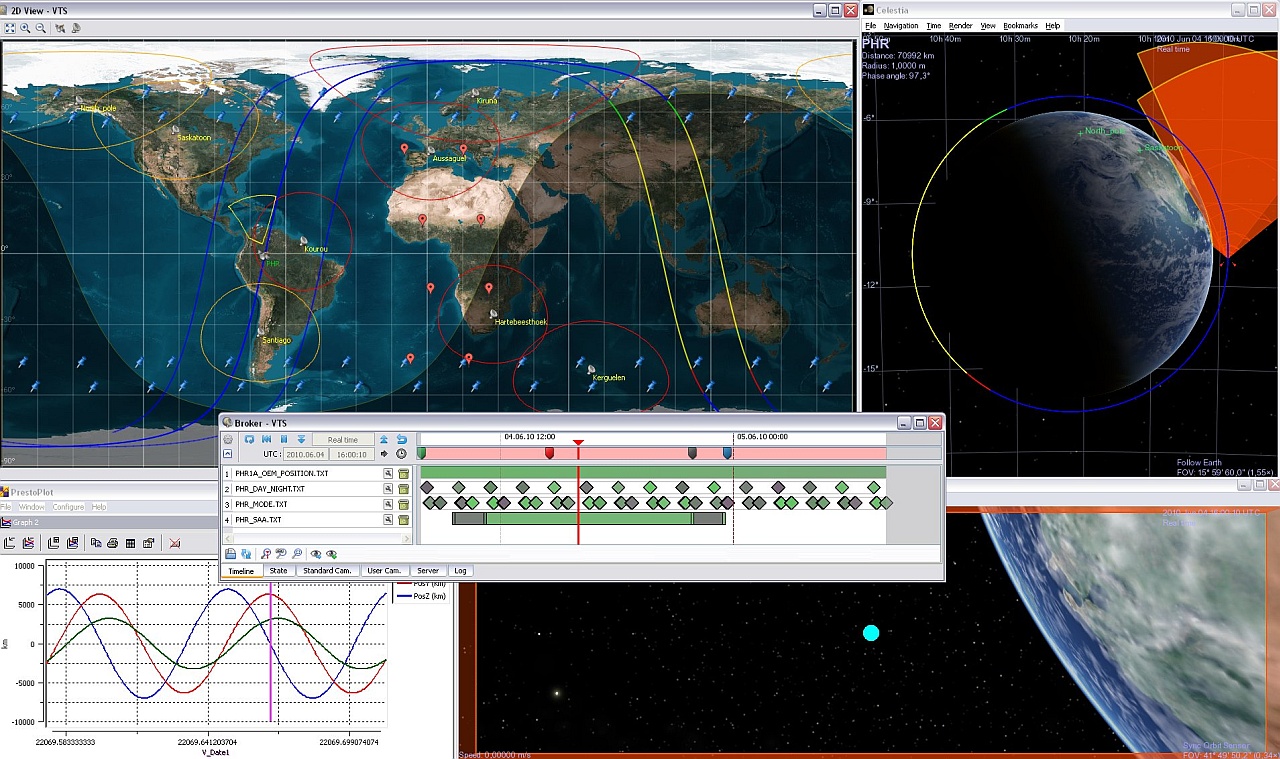
Broker
The Broker is the core application during visualization of a VTS project. It controls and synchronizes all client applications in time.
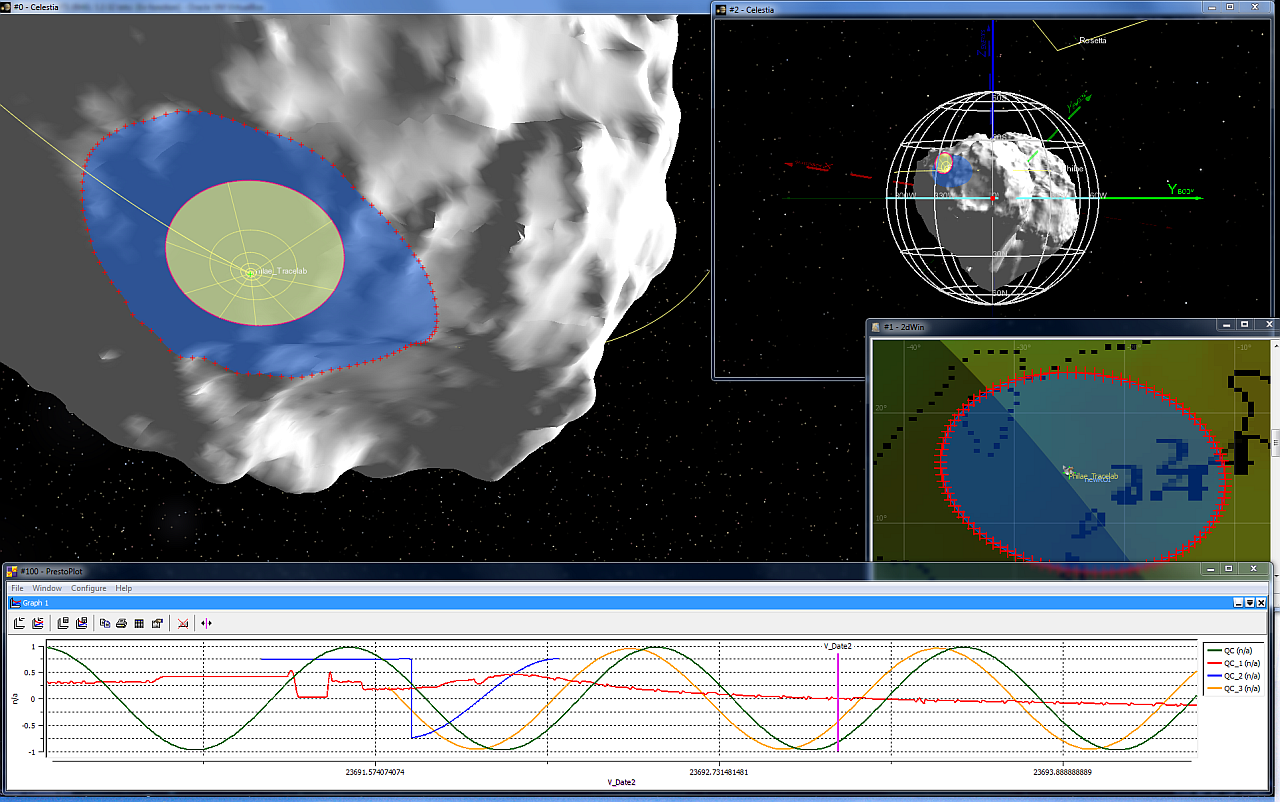
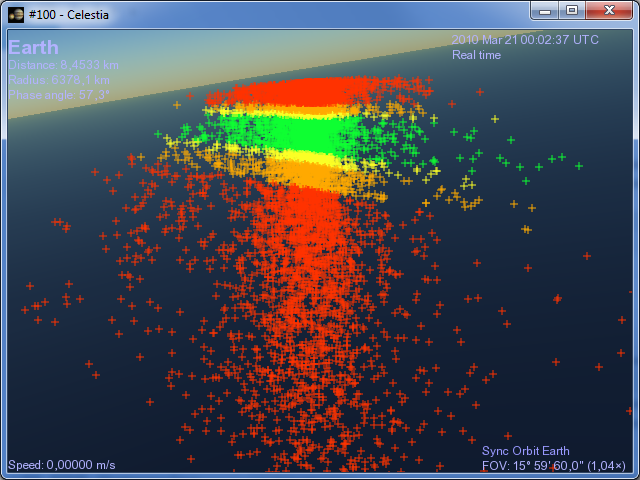
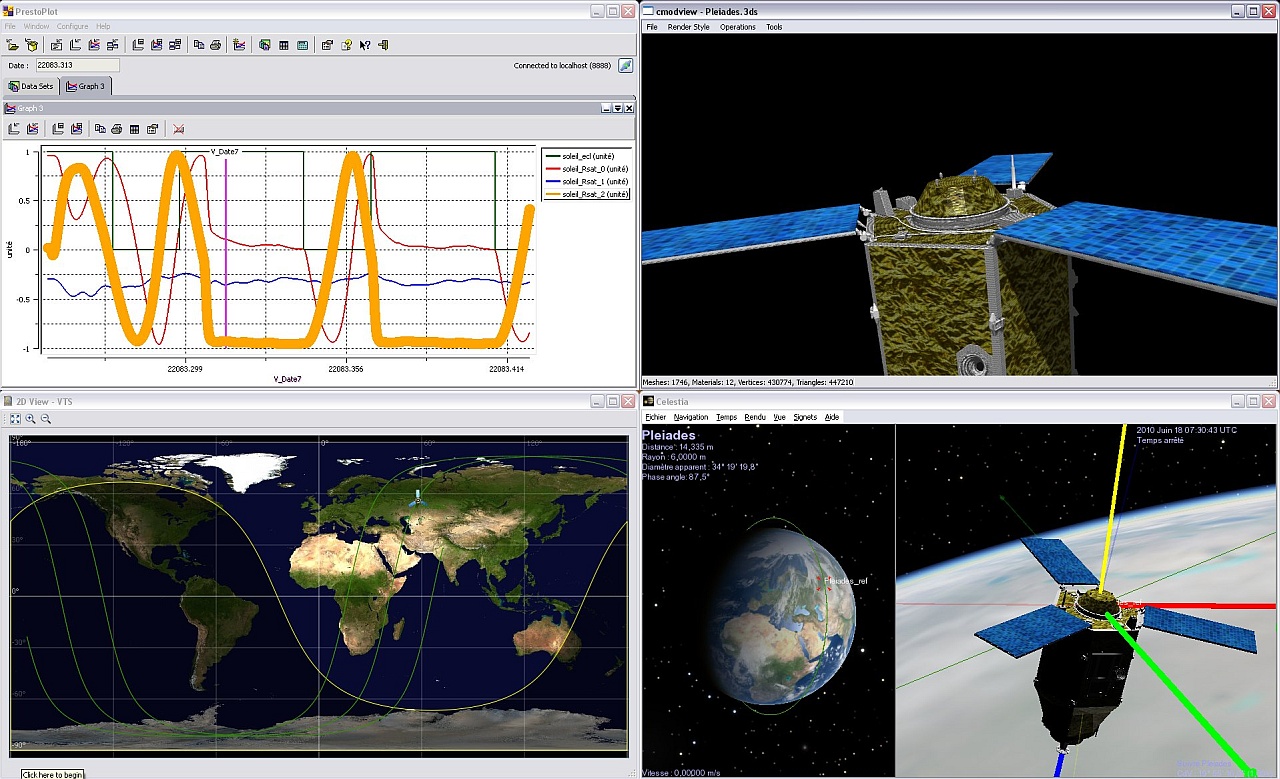
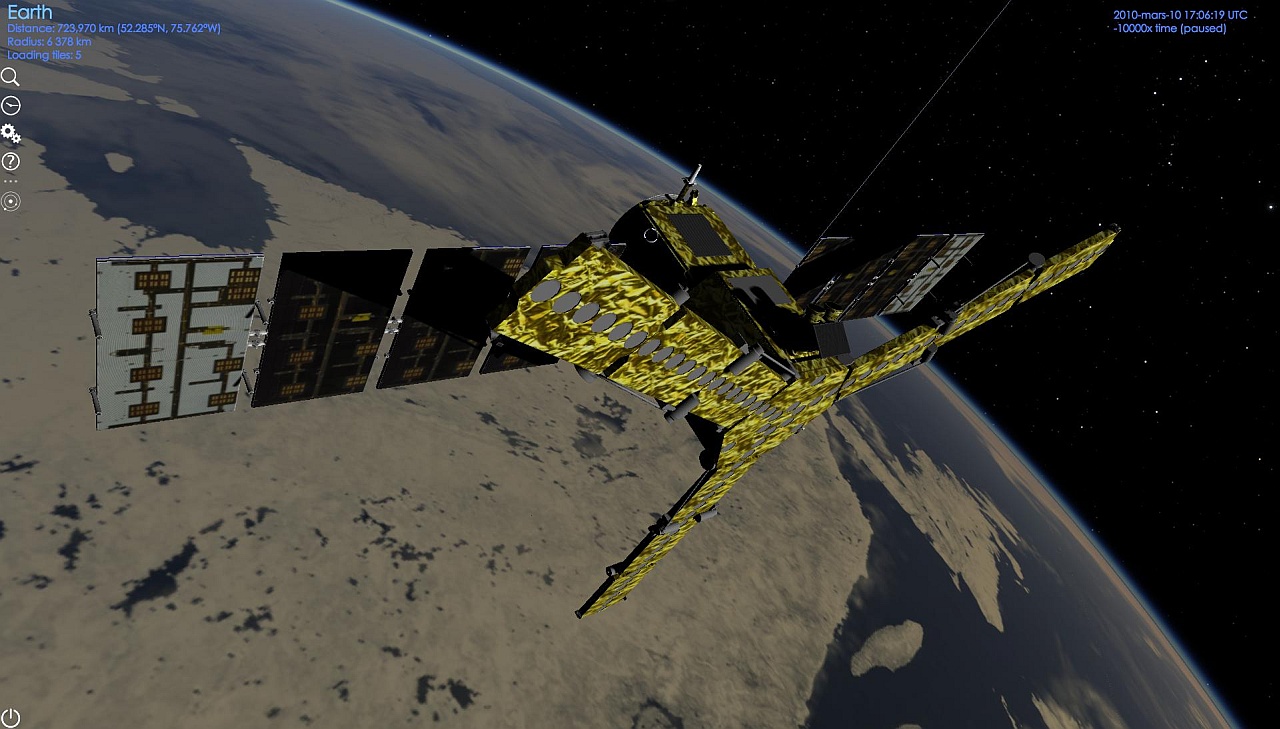
Celestia
Celestia is the main 3D client application in VTS. This open-source space simulation software is based on the Hipparcos Catalogue.
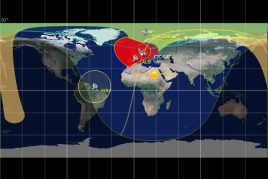
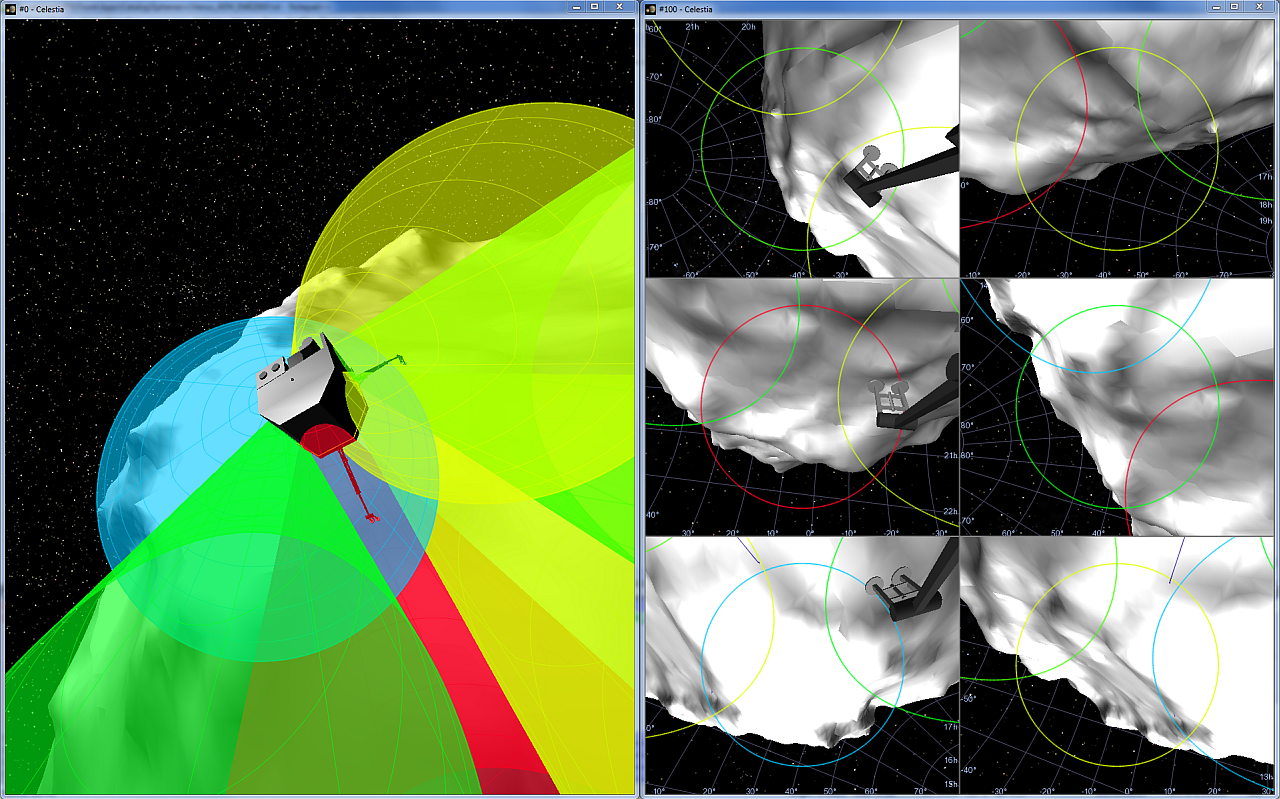
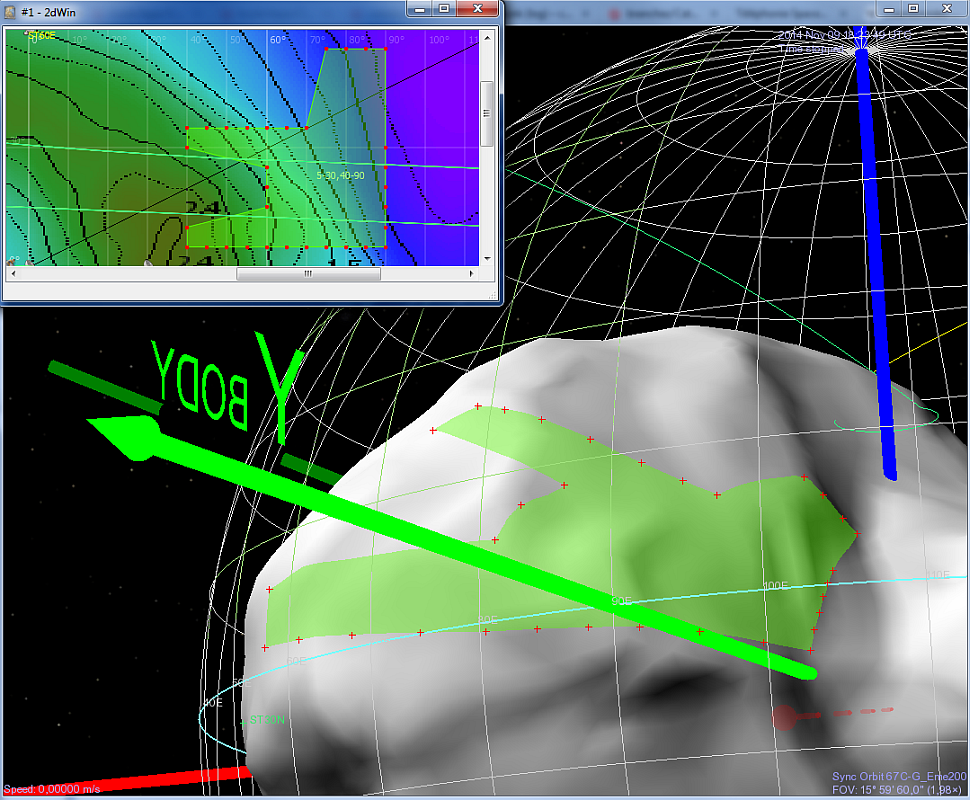
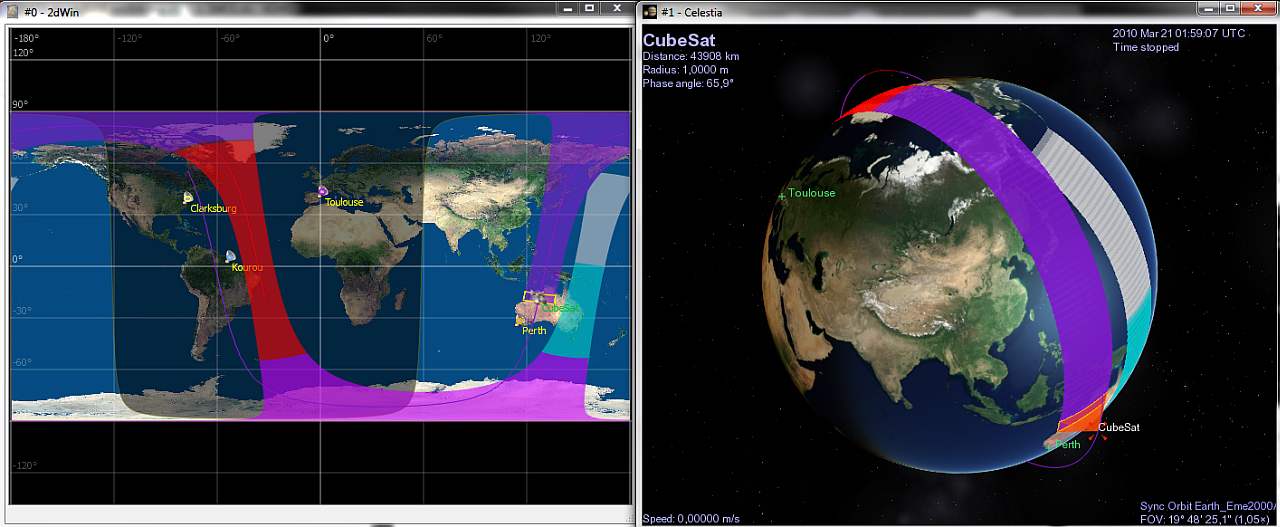
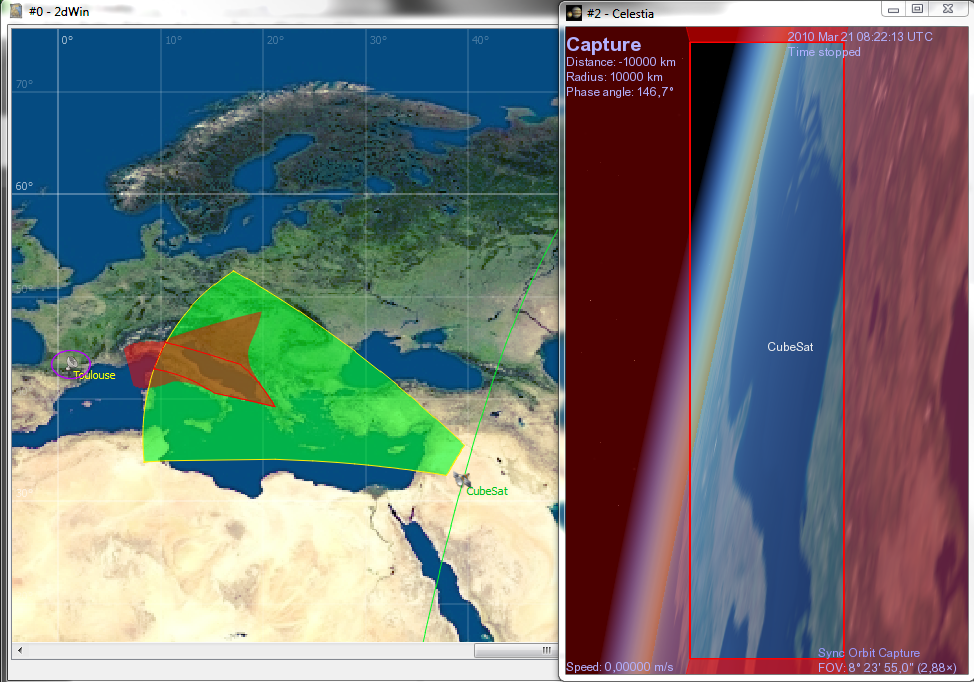
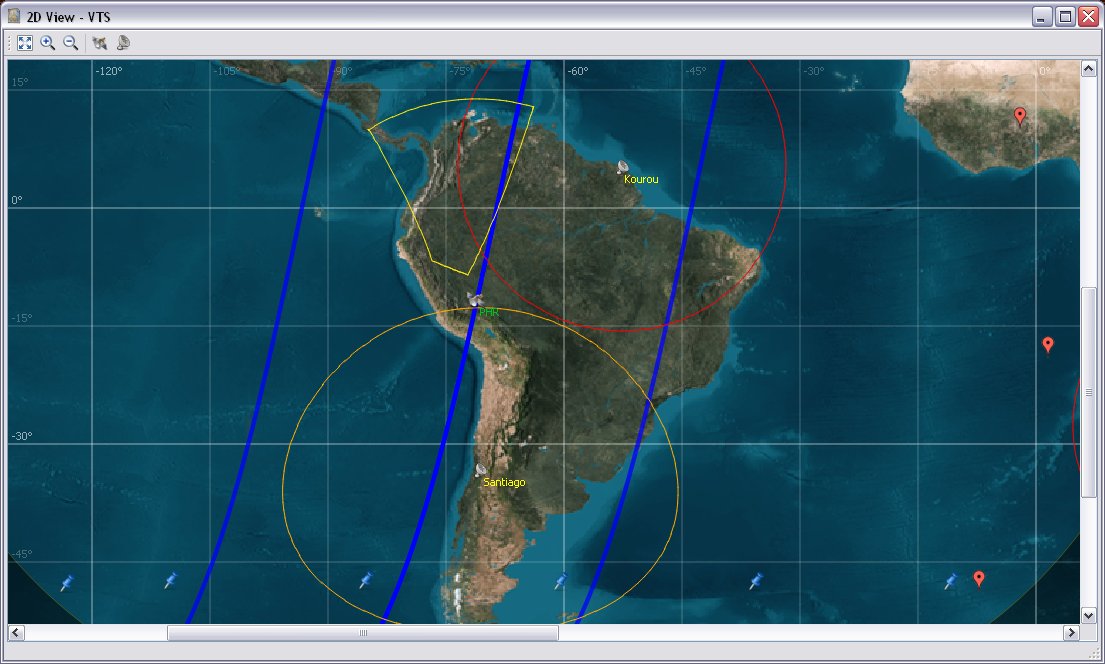
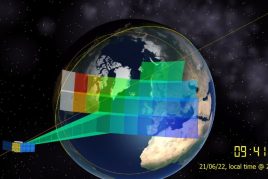
SurfaceView
SurfaceView can display a map of a planet in multiple projections. Satellite Orbits, Ground Stations, Sensor Footprints and Mission Events are examples of the multiple entities that can be visualized.
SensorView
SensorView displays a projection of the celestial sphere as seen from a satellite sensor. Celestial bodies and satellites are projected according to their position relative to the sensor.
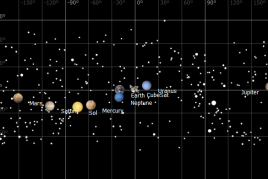
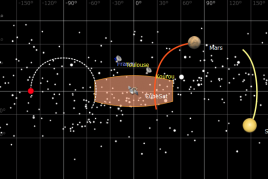
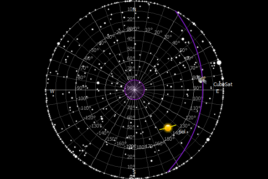
SkyView
SkyView displays a 2D star chart based on the Hipparcos Catalogue. Celestial bodies and satellites are projected into the celestial sphere.
ZenithView
The ZenithView client application displays half of the celestial sphere as seen from a specific ground station.
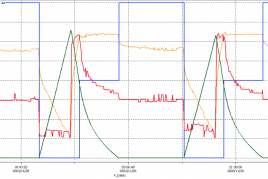
PrestoPlot
PrestoPlot is a simple, user-friendly tool for plotting time-based data such as telemetry, simulation results or experimental records.
Your Own Application
A simple communication protocol allows you to integrate your existing applications or create a specific one. Please refer to the VTS documentation to learn more about it.
Data Sources
Provide your own data
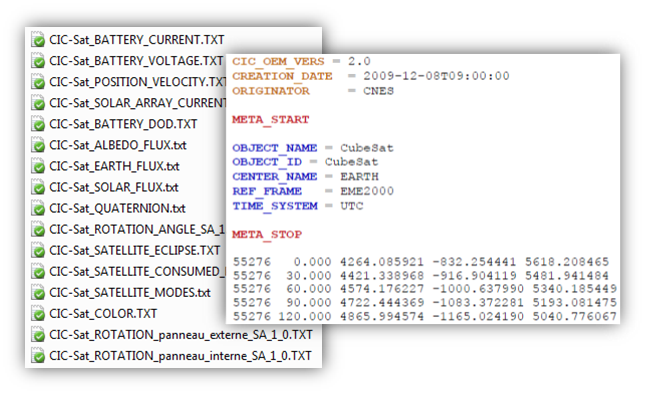
Text File Data
- CIC/CCSDS format
- Easy generation and editing
- Suitable for multiple data types
AND
Real-time Data
- Simulation
- Satellite Control Center
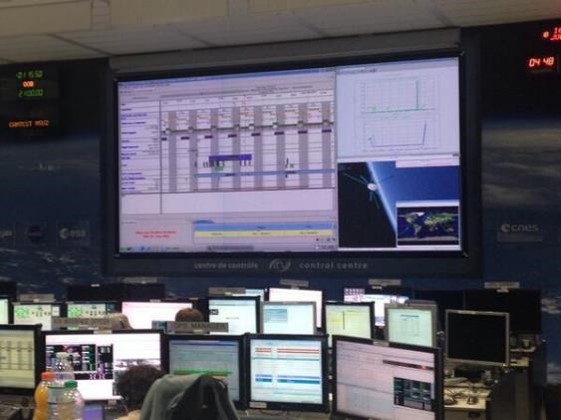
- VTS live from the ATV Control Centre :