Features
Here is a list of some PrestoPlot features
-
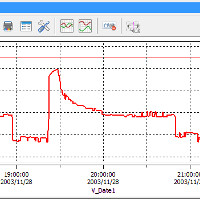
Powerful 2D plotting
PrestoPlot® facilitates the graphical representation of dated information, such as telemetry, experimental recordings or even simulation results. It has been optimized to manipulate millions of points, which can be viewed on any number of categories and ordinates.
PrestoPlot® compensates for the shortcomings of some commonly used software to visualize this kind of data. At last, you can fully devote yourself to data analysis !
-
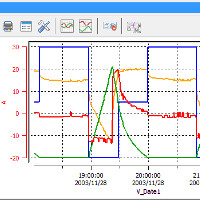
Easily accessible features
With PrestoPlot®, the addition or deletion of a set of data on an already existing chart is possible by simple drag & drop. Model files let you manage various representations (colours, layers, symbols, labels, etc.) for the various types of data you need to handle.
-
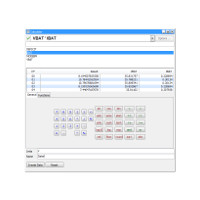
Advanced analysis features
With PrestoPlot® you can create new data sets from formulas applied to the source data. It is thus possible to trace e.g. the difference between two data sets. The flexibility of the software also allows the comparison of data recorded on disjoint time slots, or at different sampling instants.
-
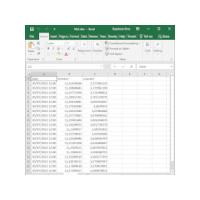
Simple and generic file formats loading
You can load data files in any CSV-like file formats, whatever column or decimal separator they use ; date format will also be automatically detected. Even Excel files can be loaded, as well as data files contained in ZIP. Finally, data can be loaded by a simple copy-paste from any application containing CSV-like data.
-
Fully extensible
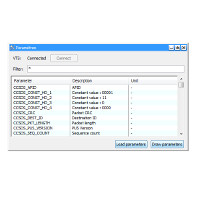
PrestoPlot® can be extended through plugins for additional file loading capabilities, new calculator functions, or even completely custom new features !
Also, through plugins, PrestoPlot® interfaces with CNES' VTS visualisation toolkit and can provide its advanced plotting capabilities during VTS visualisations.
-
Embedded and online documentation
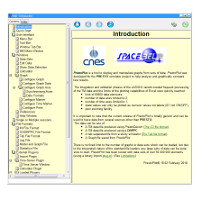
PrestoPlot® includes a comprehensive user manual that is directly accessible from the software interface and from here !
-
...