Getting Started with PrestoPlot
To get started with PrestoPlot, here are the key steps:
- Load data
- Plot graphs
- Analyse and use your graphs
Load data
PrestoPlot has a generic data loader that will, in most cases, automatically load data from a tabulated file.
You can load this data in the following ways: - Using the menu or the file load icon on the toolbar - By dragging and dropping the file from another application - By copying and pasting tabulated data from another application (spreadsheet)
Once the files have been loaded, the datasets that could be read are displayed in the datasets window.

Plot graphs
You can now select the datasets you want to display on a new graph, then press Enter, F2, or click on  to display the new graph with the selected datasets.
You can create as many graphs as you want by repeating the operation.
Analyse and use your graphs
Now that you have displayed the graphs you wanted, you can start to make your data speak by playing around with the configuration of the graphs, visual elements, markers, and conditional styling.
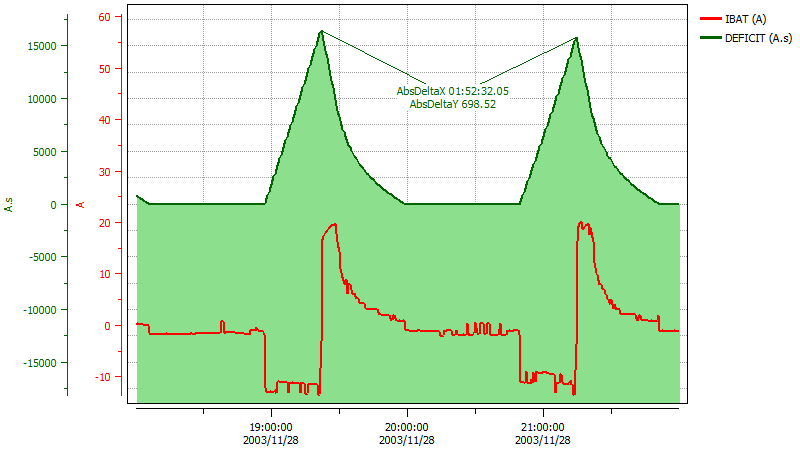
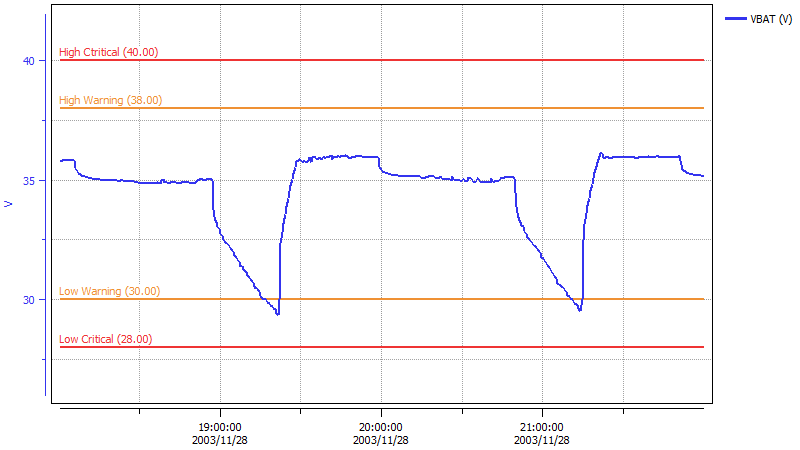
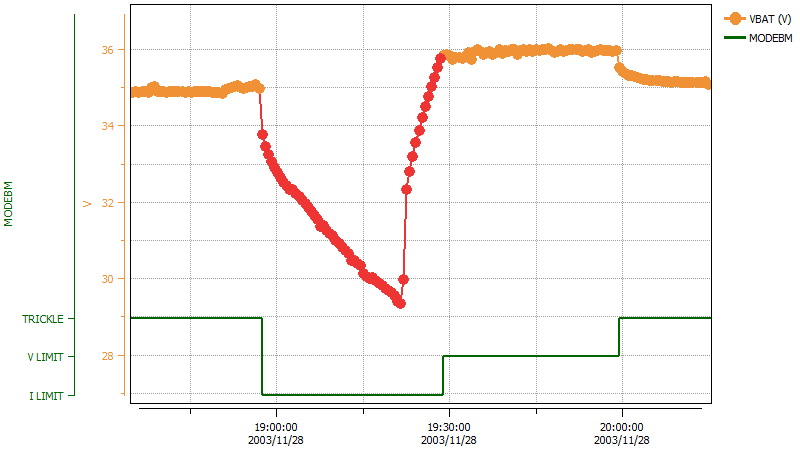
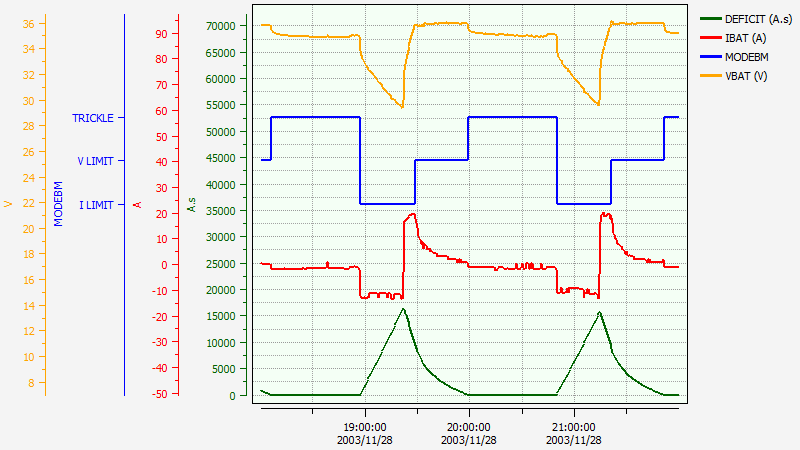
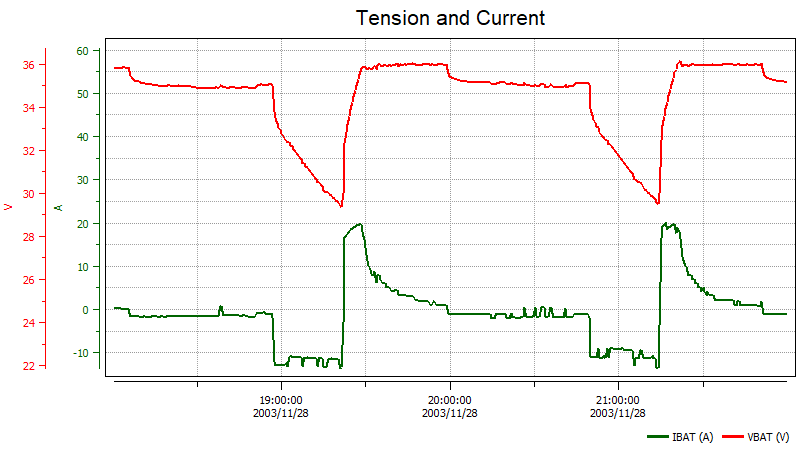
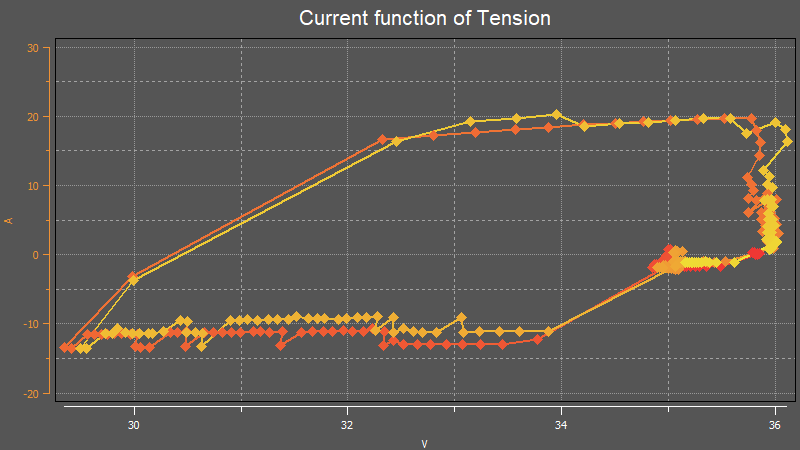
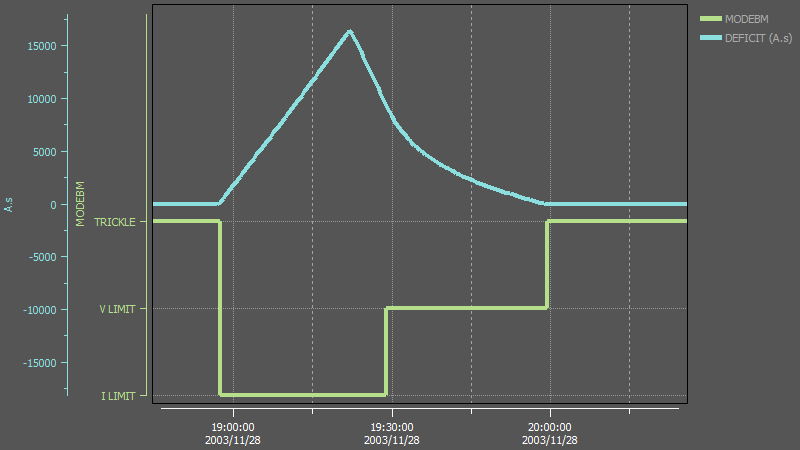
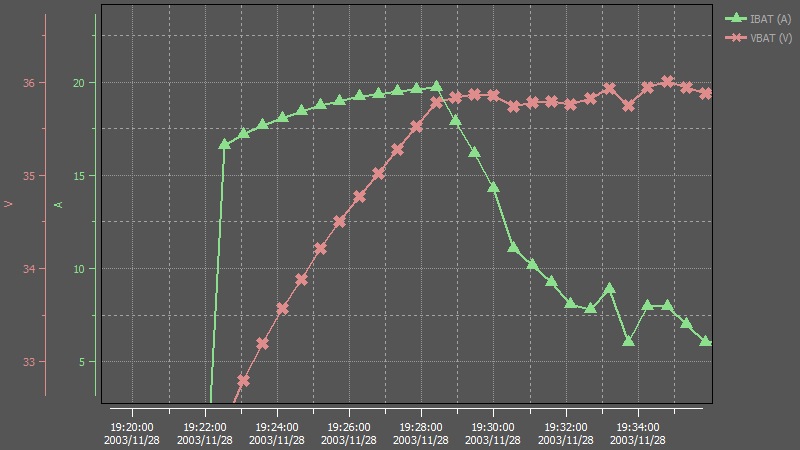
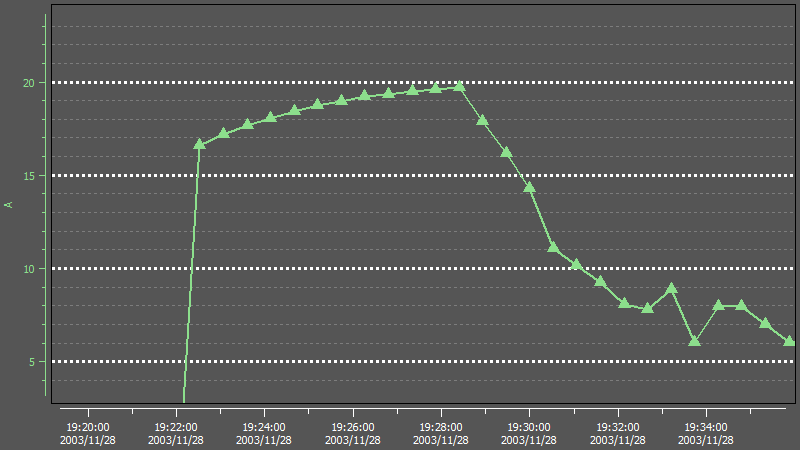
Here are some possible graph configurations :
Going further
To learn more, take a look at:
- Customizing graphs, curves and axes
- Using markers
- Using pens
- Saving your work (Models, Graphs, PGD Files, Workspaces, Projects
- Using the calculator
- Automation